


8 Simple But Important Questions to Always Ask From Your Data
Must-Known Deep Dive to Lay the Foundation of Analysis!

I often hear this question from beginners, “How do I explore data?”
Today, let’s walk through, 8 Most Important Questions you must start your analysis with, in order to Better Understand the Your Data.
These question will provide you with insights that:
Familiarize you with the dataset, including the number of records, columns, and data types.
Also, help you identify the target variable (if applicable) and understand its significance.
These questions can guide you for further analysis or decision-making processes.
If you’re new here Subscribe, as my goal is to simplify Data Science for you. 👇🏻
Before diving into the dataset, let’s load dataset:
Importing Libraries and Data
import pandas as pd

data = pd.read_csv("product_data.csv")
Now, we’re ready to explore this dataset.
1. Data Size:
First thing to begin with, is understanding the size of your dataset (number of rows and columns), to know what are you dealing with!
Question: How big is the data?
Approach: Check the shape of the dataset.
--
shapereturns the number of rows and columns.
data.shape

# Output: (60, 7)
2. Data Preview:
Next, it’s important to have a quick glance of your dataset to understand its features better.
Question: What does the data look like?
Approach: Look at the first few rows of the dataset using head() or sample().
--
head()displays the first few rows of the dataset.
data.head(5)
--
sample()displays the randomly selected items rows of the dataset.
data.sample(5)
3. Data Types:
Every column in your dataset holds specific type of features, like numbers or text.
Question: What types of information are stored in each column?
Approach: Check the data types of each column using dtypes or info().
--
info()provides information about the dataset, including memory usage.
data.info()"""Output:
<class 'pandas.core.frame.DataFrame'>
RangeIndex: 60 entries, 0 to 59
Data columns (total 7 columns):
# Column Non-Null Count Dtype
--- ------ -------------- -----
0 ProductID 60 non-null int64
1 ProductName 60 non-null object
2 Category 60 non-null object
3 Price 60 non-null int64
4 CustomerRating 60 non-null float64
5 PromotionType 60 non-null object
6 CustomerAge 60 non-null object
dtypes: float64(1), int64(2), object(4)
memory usage: 4.8+ KB
"""--
dtypesreturns the data types of each column.
data.dtypes"""Output:
ProductID int64
ProductName object
Category object
Price int64
CustomerRating float64
PromotionType object
CustomerAge object
dtype: object
"""Note: This helps you identify whether any columns requires cleaning or conversion from one datatype to another (for reducing the memory usage of data) before analysis.
4. Missing Values:
ML Models hates missing values, that’s why it’s really important to ask this question:
Question: Are there any null or missing values in the data?
Approach: Check for the presence of missing values using isnull() or isna().
--
isnull().sum()orisna().sum()gives the total number of missing values per column.
data.isna().sum()--
isnull().mean() * 100provides the percentage of missing values.
data.isnull().mean() * 100"""Output:
ProductID 0.0
ProductName 0.0
Category 0.0
Price 0.0
CustomerRating 0.0
PromotionType 0.0
CustomerAge 0.0
dtype: float64
"""Note: If your data is clean (as in this case), that’s great and rare! If not, you have to strategically handle these anomalies.
5. Statistical Overview:
The three generally estimated parameters of central tendency are mean, median, and mode.
-- Mean is the average of all values in data.
-- While the mode is the value that occurs the maximum number of times.
-- The median is the middle value with equal observations to its left and right.
To better understand your data’s central tendency and variability, use descriptive statistics.
Question: How is the data distributed statistically?
Approach: Obtain statistical measures using describe().
--
describe()gives statistical measures for numerical columns.
data.describe().transpose()
For more depth, analyze the skewness of your data, because ML Algorithms like Linear Regression, Logistic Regression, etc., assumes that the data follows a normal distribution.
data["CustomerRating"].skew()

# Output: 0.28629649843102617
6. Duplicate Data:
It not recomment to provide duplicates to your ML Algos, as it may leads to overfitting.
Question: Are there duplicate values?
Approach: Identify and remove duplicates using duplicated().
--
duplicated().sum()counts the number of duplicate rows.
--
drop_duplicates()removes duplicate rows.
print("Total duplicate values are '", data.duplicated().sum(), "'.")

# Output : Total duplicate values are ' 0 '.
7. Correlation Analysis:
Use correlation analysis to understand and identify how features are related to each other.
Question: How are different columns related to each other?
Approach: Examine the correlation matrix and visualize it if needed.
--
corr()calculates the correlation matrix.
--
heatmap()visualizes the correlation matrix.
data.corr()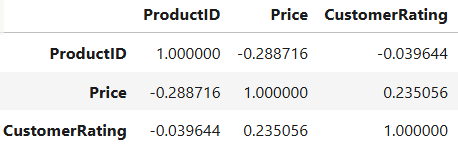
8. Exploring Diversity:
Finally, it’s also helpful to examine the diversity and variety within a categorical column.
Question: How many unique values are there in a specific column?
Approach: Use the nunique() method to find the number of unique values in a particular column.
--
nunique()method returns the number of unique values for each column.
data["ProductName"].nunique()

# Output : 60Note: Higher unique values may indicate a more diverse range of categories, which might be significant depending on your analysis goals.
By answering these 8 essential questions, you lay a strong foundation for deeper analysis, whether it’s predictive modeling, or decision-making.
If you’d like to explore the full implementation, including code and data, then checkout: Github Repository. 👈🏻
And that’s a wrap, if you enjoyed this deep dive, stay tuned with ME, so you won’t miss out on future updates.
Until next time, happy learning!
Got it ma'am but what one should exactly understand what does statistical data says?