


Correlation Doesn't Implies Causation!
Covariance Vs Correlation Coefficients and Their Significance

Correlation Doesn't Implies Causation!
You may have heard this statement many times, but there's a high chance you might be confused between the two terms.
To better understand this, you first need to have clear basics of Covariance Vs Correlation Coefficients and their Significance.
Many data enthusiasts suffer from dry statistics courses, which often become their least favorite subject. Subscribe as here, I want to make it easy for you. 👇🏻
Why Covariance, if we have Variance?
There, we have already discussed that Variance, is a statistical measure which is not the true representation of spread.
It provides insights into the variability of individual variables, but it does not capture the relationship between multiple variables.
In other words, it doesn't quantifies the extent to which changes in one variable are associated with changes in another variable.
Simply stating, it does not describes relation between two variables.
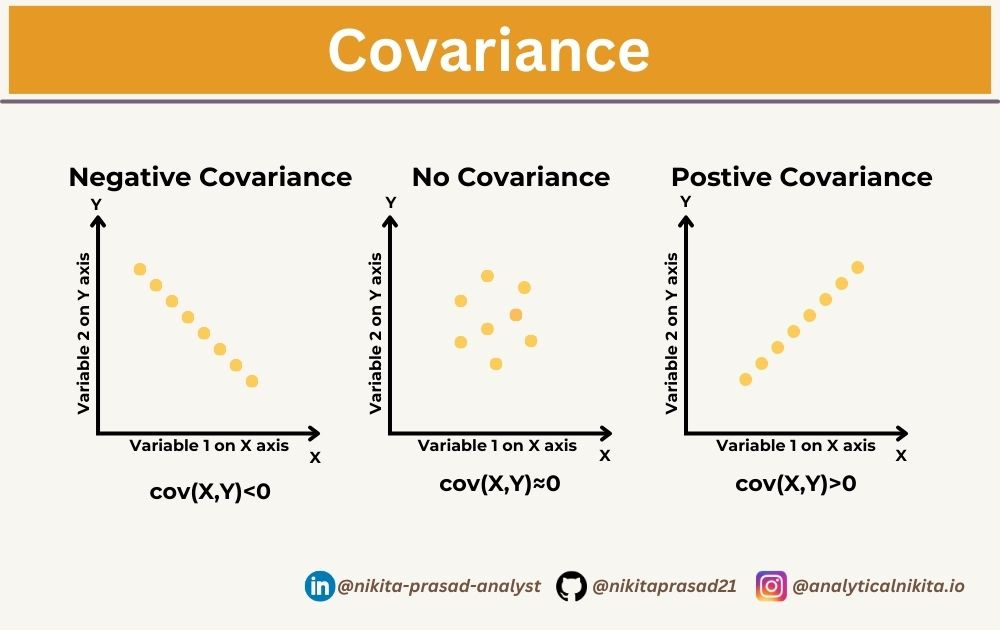
How Covariance Solves this Problem?
Covariance indicates whether changes in one variable are positively or negatively associated with changes in another variable.
Statistically speaking, it describes the degree to which two numerical variables are linearly related.
Covariance Formulae are shown in below table:
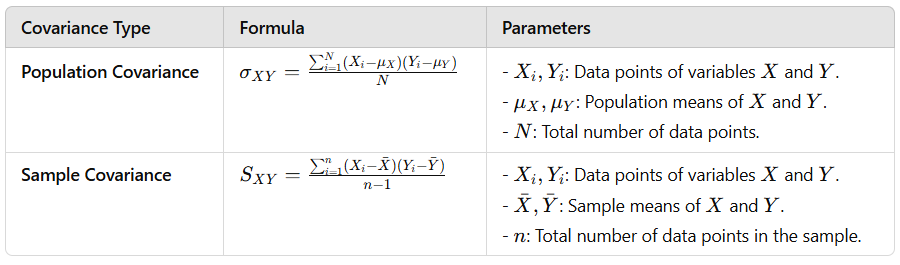
Majorly, it is used in predictive modeling and regression analysis to help us understand the inter-dependence between predictor variables and the target variable, enabling the development of accurate predictive models.
Major Limitation of Covariance
But, certainly, there are some drawbacks of Covariance, and the most important one is:
It does not tell us about the strength of the relationship between two variables, meaninng the magnitude of covariance is affected by the scale of the variables.
Let’s prove this!
fig, ax = plt.subplots(1, 3, figsize=(15, 3))

# Plot scatterplots on each axes

# Scatterplot of variable x against variable y
ax[0].scatter(df['x'], df['y'])
# Scatterplot of variable x multiplied by 2 against variable y multiplied by 2
ax[1].scatter(df['x']*2, df['y']*2)

ax[0].set_title("Covariance - " + str(np.cov(df['x'],df['y'])[0,1]))
ax[1].set_title("Covariance - " + str(np.cov(df['x']*2,df['y']*2)[0,1]))

# Show the plot
plt.show()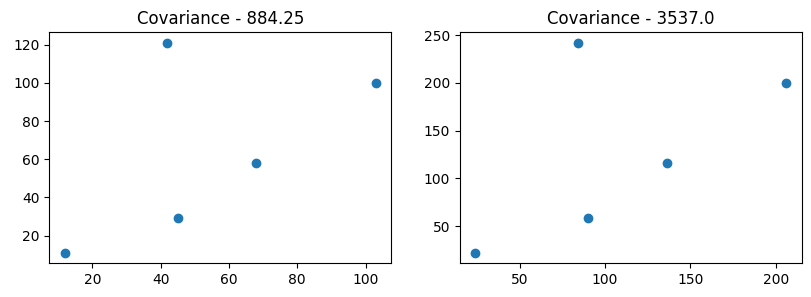
In above graph, it is fairly proven that by just multiplying with 2, the covariance variance has increased fourfold.
This not appreciated, as Covariance is not normalized which means it does not have a bounded range. Therefore, it is not suitable for comparing the strength of relationships across different datasets or variables.
What is Correlation?
It is a statistical measure that quantifies the strength and direction of the linear relationship between two variables.
Basically, it measures the degree to which two variables are related and how they tend to change together, using given below formulae.
Pearson Correlation Coefficient Formulae are shown in below table:
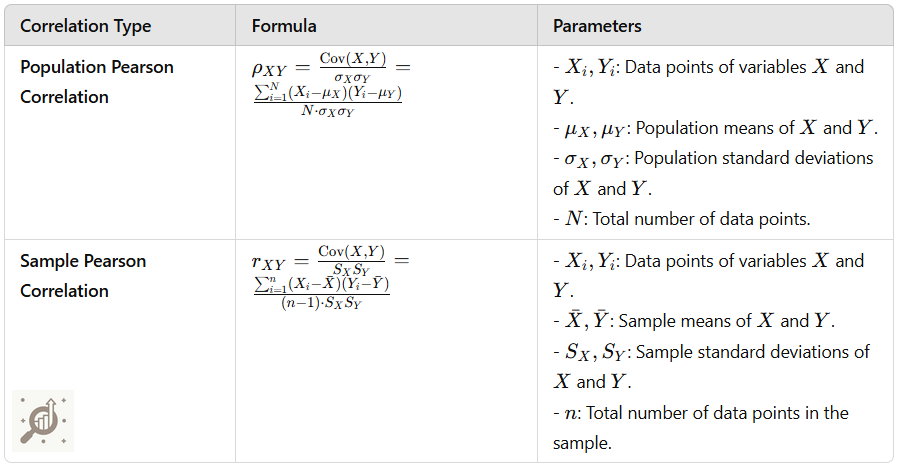
Correlation values range from -1 to 1, where:
A
correlation coefficient of 1indicates aperfect positive linear relationship, meaning that as one variable increases, the other variable also increases proportionally.A
correlation coefficient of -1indicates aperfect negative linear relationship, meaning that as one variable increases, the other variable decreases proportionally.
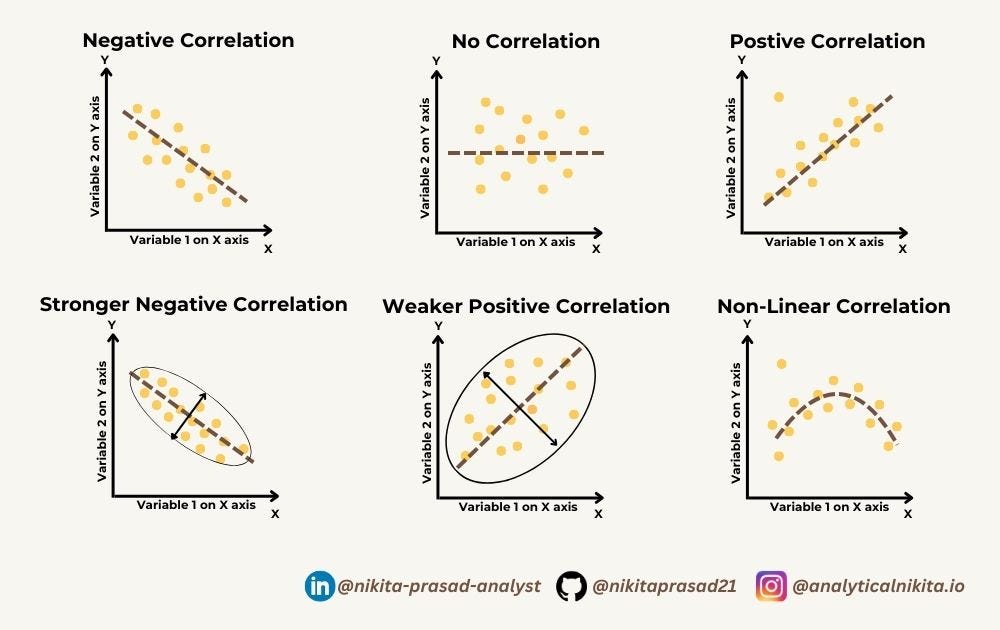
A
correlation coefficient of 0indicatesno linear relationshipbetween the variables.
Further, it can also measure the strong or weak or non linear correlation among the variables.
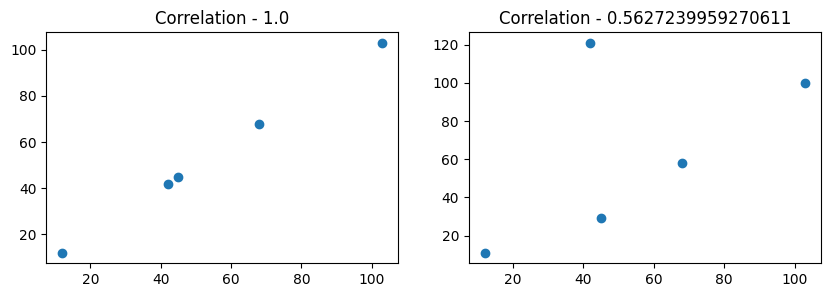
ax[0], The correlation of a variable with itself is always 1, as it represents the perfect positive linear relationship.
ax[1], The correlation between variables
xandyrepresents the strength and direction of their linear relationship.
And, most importantly,
It Doesn't Depend On The Scale of DATA.
Let's prove!
# Create subplots with two axes
fig, (ax1, ax2) = plt.subplots(1, 2, figsize=(10, 3))

# Plot scatterplots on each axes
ax1.scatter(df['x'], df['y'])    # Scatterplot of 'x' against 'y'
ax2.scatter(df['x']*2, df['y'])  # Scatterplot of 'x' multiplied by 2 against 'y'

# Set titles with correlation coefficients
ax1.set_title("Correlation - " + str(df['x'].corr(df['y'])))
ax2.set_title("Correlation - " + str((df['x']*2).corr(df['y']*2)))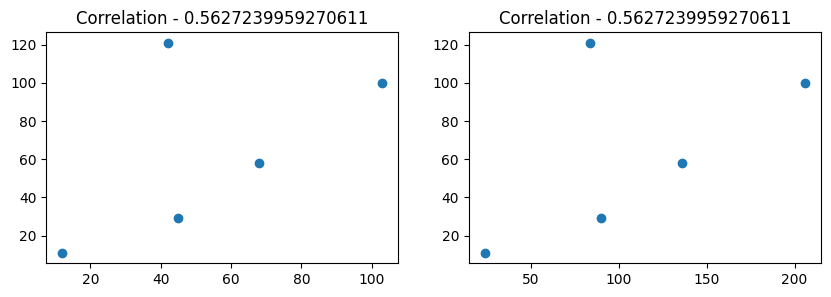
ax[0], The correlation between
xandyrepresents the strength and direction of their linear relationship.ax[1], The correlation between
xmultiplied by 2 andyremains the same as the original correlation,
Clearly, scaling the variables does not change the linear relationship between them.
How to measure Non-Linear Correlation among variables?
The Pearson correlation coefficient, which is the most commonly used measure of correlation, quantifies the strength and direction of the linear relationship between two variables.
However, it is important to note that the Pearson correlation coefficient may still capture some aspects of non-linear relationships, especially if the non-linearity is mild.
If the relationship between variables is non-linear, alternative measures of correlation may be more appropriate such as :
Spearman's Rank Correlation: It assesses the strength and direction of the monotonic relationship between two variables, based on the ranks of the data rather than the actual values and is often used when the relationship between variables is non-linear or if the data is ordinal.
Kendall's Tau: It is another non-parametric measure of correlation that assesses the ordinal association between two variables. Also, it is robust outliers.
Non-Parametric Correlation: There are also other non-parametric measures of correlation that can capture non-linear relationships, such as the
distance correlationor themaximal information coefficient (MIC). They don’t assume a specific functional form for the relationship between variables and can capture complex non-linear dependencies.
Now, let’s take a closer look at what causation is. Then we’ll explore how to apply it in your business problem.
What is Causation?
When two phenomena have a causal relationship, it means that X thing causes Y thing.
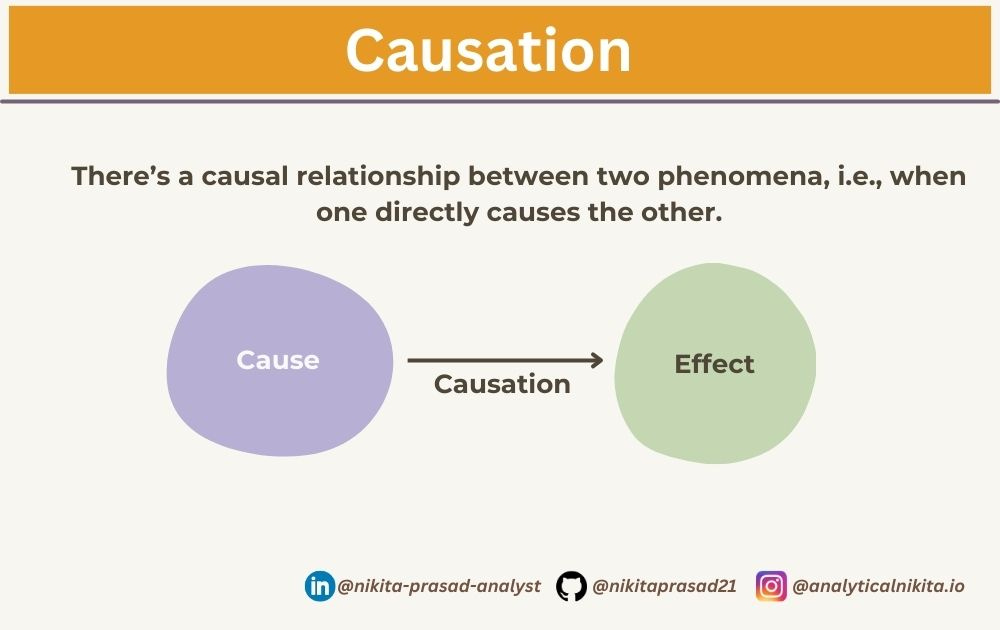
Say, he jammed his thumb in the door, and now it hurts, A fair real-life example of, we do something (X) and that leads to something else (Y).
Example:
Let's say you work for an e-commerce company, and your goal is to increase sales by optimizing online advertising strategies.
You have data on daily advertising spending (in dollars) and daily sales revenue (in dollars) for the past year.
➡️ Correlation:
You start by analyzing the correlation between daily advertising spending and daily sales revenue.
After calculating the correlation coefficient, you find a strong positive correlation between the two variables, indicating that days with higher advertising spending tend to have higher sales revenue.
This correlation suggests an association between advertising spending and sales but does not imply causation.
➡️ Causation:
To determine whether advertising spending directly causes an increase in sales revenue, you decide to conduct a controlled experiment.
You randomly select a group of customers and expose them to an advertising campaign while keeping another group as a control group with no exposure to the campaign. After the campaign, you compare the sales revenue between the exposed group and the control group.
If the exposed group shows a significant increase in sales revenue compared to the control group, you may conclude that the advertising campaign caused the increase in sales. This establishes a causal relationship between advertising spending and sales revenue.
However, if there is no significant difference in sales revenue between the exposed group and the control group, you cannot conclude that the advertising campaign caused the increase in sales.
Other factors may be influencing sales, and the correlation observed earlier may be due to confounding variables.
Correlation is a far more common relationship between 2 variables than causation.
Most Important!!!
In data science, while corr() can provide you with valuable insights on how different variables are related, it cannot be used to establish the causality among the events.
Establishing causality often require additional evidence achieved through experiments, random controlled trial (A/B tests), well designed surveys, observational studies, domain knowledge and other statistical measures.
If you’d like to explore the full implementation, including code and data, then checkout: Github Repository. 👈🏻
And that’s a wrap, if you enjoyed this deep dive, stay tuned with ME, so you won’t miss out on future updates.
Until next time, happy learning!